
We’ve made some radical changes to the math behind our open-source A/B testing library, Confidence.js.
We want to bring you up to speed on how it works.
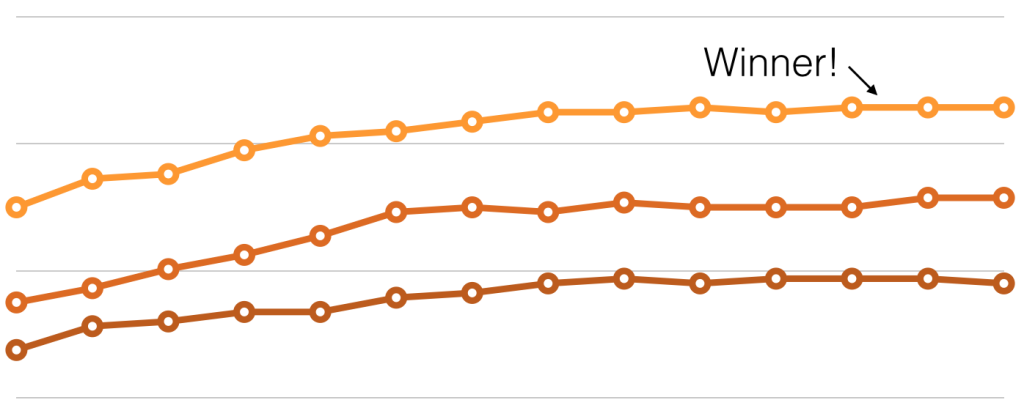
A/B Test Results
The Old Way: The Z-Test Method
When we originally wrote Confidence.js, we took a very traditional approach. We looked to the industry standard for A/B testing, the “Z-Test Method“.
The Z-Test Method is widely used by A/B testing services like Optimizely and Visual Website Optimizer. Both of those companies provide excellent resources on this topic but in short, the Z-Test Method works like this:
- Take the average success rate of each variant
- Use the average to predict how that variant will perform in the future
- If we predict one variant to perform better than the others, call it the “winner”
The Z-Test Method is one of the hundreds of ways to perform statistical significance testing. After releasing Confidence.js and using it inside Sendwithus, we started to find that the Z-Test Method didn’t quite serve our customer’s needs, especially when comparing more than two variants.
The short reason is that the Z-Test Method does not control for overall error rate. In other words, as more variants are added, results become less accurate (more on this later).
This significantly impacts the value of A/B test results. It also requires a fairly large sample size to produce meaningful results, which makes testing multiple variants quite time-consuming.
This is a problem for us – we know first hand that our customers want to be testing many variants at once, and we need to provide accurate results quickly.
Using Chi-Squared + Marascuillo’s Procedure
We gave this problem a lot of thought and research and decided to try something new. We updated Confidence.js to use a new statistical method, better designed for evaluating A/B test results.
This new method uses a combination of Chi-Squared Tests and Marascuillo’s Procedure to determine a winning variant.
First, we use Chi-Squared Tests to determine if differences in the A/B test data are meaningful or not. This is called “testing difference of proportions”. Paul Andersen has a great video explaining the math. We then use Marascuillo’s Procedure to determine if one variant performed statistically better than the others.
In general terms, this new method works like this:
- Determine if any variant stands out from the rest
- Check the best performing variant against the others
- If the best performing variant is one that “stands out”, call it the “winner”
This approach has overall error rate control built-in and often requires a smaller sample size to produce meaningful results.
What this means for Confidence.js (and Sendwithus customers) is that A/B tests with multiple variants can produce statistically meaningful results in a shorter time frame.
Additional Resources:
- Want to see the code? Check out Confidence.js on github
- Interested in the math? See a very technical explanation below
Why Switch? A Statistical Perspective.
This next part was written by stats superstar Emily Malcolm and goes pretty deep into the statistical reasons we’re switching from Z-Tests to Chi-Squared and Marascuillo’s Procedure. You’ve been warned =]
The Z-Test method conducted a Difference of Proportions Test using a Z Statistic. This method is simple and effective for comparing the population proportions between two variants. However, one of the main concerns with this methodology is that when comparing more than two variants, the familywise error rate (the probability of at least one Type I Error in any of the comparisons) is not controlled, and we cannot be as confident in our results.
Our new approach uses Pearson’s Chi-Square Test which is a standard methodology to test population proportions. The null hypothesis that there is no difference in proportions for any of the variants is tested against the alternative hypothesis that at least one of the variants is different from the others. The details of how this test is conducted can be found in our Chi-Squared Cheat Sheet.
The conventional rule of thumb for sample size for the Pearson’s Chi-Square Test is that 80% of the expected frequencies need to exceed 5 and all expected frequencies need to exceed 1, although this varies slightly depending on who you talk to. To be conservative, we require all expected frequencies to be at least 5. Other than this requirement, sample size requirements for the Chi-Square Test are vague – a definite disadvantage. However, one (arguable) strength of the Pearson’s Chi-Square Test is that is “non-parametric”, meaning that it makes no assumptions about the distribution of the population.
If Pearson’s Chi-Square Test suggests we have significant evidence against the null hypothesis (that all the proportions for all variants are the same), we can continue on to conduct a post hoc analysis to examine the difference between pairs of variants. This allows us to determine where an ordering or ranking of variants can (or cannot) be established. To do this, we use Marascuillo’s Procedure. Implementation details can be found in our Marascuillo’s Procedure Cheat Sheet. This procedure helps us identify a clear “winner” from a group of many variants.
Note: Alternatives to Pearson’s Chi-Square Test were considered. Bernard’s Exact Test and Fisher’s Exact Test each would have their advantages in this situation, however, both can be time-consuming to compute. It was determined that if cell counts were high enough Pearson’s Chi-Square Test would be sufficient. Provided cell counts are high, a G-Test would also be applicable. Unlike the Chi-Square Test, the G-Test can be used for more elaborate statistical designs and thus sometimes preferred for simpler designs. However, the Chi-Square Test has the advantage of being more familiar to more people and is more commonly used. Although there is still room for improvement, particularly in sample size determination, using Pearson’s Chi-Square Test and Marascuillo’s Procedure is certainly an improvement over the old Z-Test Method from a statistical standpoint.